View Menu
Adjust your workspace by toggling IJK orientation columns, expanding data trees, and calculating point-to-point distances for better path visualization.
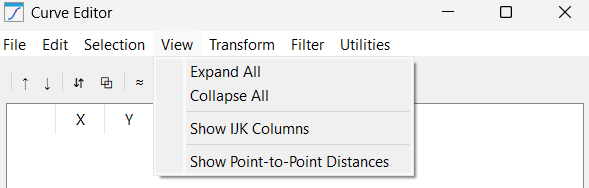
This menu provides tools to manage the visual density of the data table and tree as listed below:
1.Expand All: Fully opens the tree structure to show every point inside every curve. While useful for deep inspection, it can result in a very long list when working with high-resolution paths.
2.Collapse All: Tucks all points back into their parent curve folders. This is the preferred view for organizational tasks like sorting or merging, as it prevents the UI from becoming cluttered.
3.Show IJK Columns: Toggles the visibility of the orientation vectors. If your application is a simple 3-axis task (like a flat waterjet cut), you can hide these to simplify the interface.
4.Show Point-to-Point Distances: Calculates and displays the millimeter gap between each point. This is an invaluable diagnostic tool for finding gaps in a path that might cause a robot to "jump" or trigger a speed error.