Thread Rating:
  • 0 Vote(s) - 0 Average
  • 1
  • 2
  • 3
  • 4
  • 5

Fanuc M710-iC/45M J2-J3 coupling

#1
Hi,found some more issues on macOS(on m4, I haven't tried on intel).

Robot: Fanuc M-710iC/45m
First of all, I can't open J2/J3 couplings by clicking on j2/j3 limit (macOS).

Secondly, when I change the j2 or j3 limit, it does not apply, apparently because the j2/j3 coupling setting prevails (in any case, the visual display does not change) (see j2 in the screenshot (mac OS))
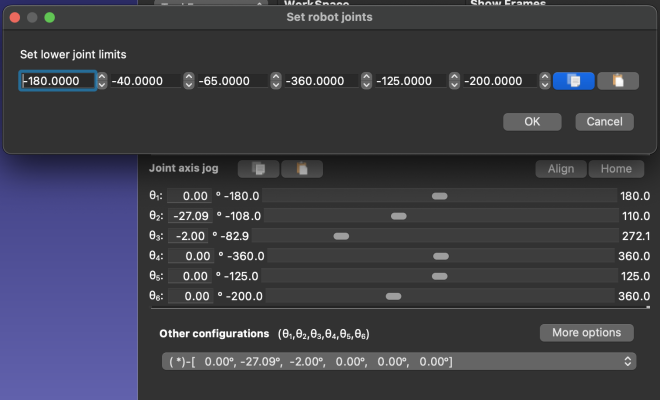
.png   scr.png (Size: 212.63 KB / Downloads: 69)


Thirdly, the restrictions on the relative position of the axes on Fanuc look somewhat more complicated than a straight trapezoid from the lowest position in j2 to the top position.
I am attaching
several pages of FANUC documentation. 
.pdf   j2limits.pdf (Size: 372.72 KB / Downloads: 54)
.pdf   j3limits.pdf (Size: 278.96 KB / Downloads: 54)


It looks like this:
1.
First, we have a limit of minimum and maximum values for j2 and j3.
Quote:j2 min = -90 deg.
j2 max = 135 deg.

j 3 min = -160 deg.
j3 max = 280 deg.
And these limits can never be exceeded.


2. But at the same time, the condition must be fulfilled at each point that:
Quote:(-80.5 deg. <= j2+j3 <= 205 deg.)
-----------------------------------------------------
Therefore
Quote:if j2 = -90 deg.
the limits of j3
will be:
min. = 9.5 deg. (because ( (-80.5) - (-90)  = 9.5))
max. = 280 deg.
(j3 max value)
and when
Quote:j2 = 135 deg.
j3 min. = -160 deg. (j3 min)
j3 max. = 70 deg. (205 - 135 = 70)
but at the same time, at
Quote:j2 = 0 deg.
j3 min = -80.5 deg. (-80.5 - 0)
j3 max = 205 deg.    (205 - 0)
(if we set the dependence j2/j3 only along the left and right boundaries of j2, then j3 = 205 will not lie inside the trapezoid)

----------------------------------------

Limits of each
joint for Fanuc M-710iC/45m:
Code:
joint_limits = [[-180, -90, -160, -360, -125, -360],[180, 135, 280, 360, 125, 360]]
[[min],[max]]

---------------------------------------
I was trying to specify a j2/j3 dependency on windows
That's how it
turned out well, but there is a problem with j3 = 205 when j2 =
.png   205problem.PNG (Size: 47.76 KB / Downloads: 58)


If you don't specify the 0 point times, the graph turns out to be very strangely shaped. 
.png   broken.PNG (Size: 55.42 KB / Downloads: 55)


Thanks for attention, would be glad if you would update the logic of limits and the dependency between j2 and j3 for FANUC.  😊
#2

.png   IMG_1630.png (Size: 115.52 KB / Downloads: 57)
This graph illustrates the correct value of j3, over the entire range of j2. With default limits
Code:
import numpy as np
import matplotlib.pyplot as plt

j2_min, j2_max = -90, 135
j3_min, j3_max = -160, 280

def valid_j3(j2):
    j3_lower = max(j3_min, -80.5 - j2)
    j3_upper = min(j3_max, 205 - j2)
    if j3_lower > j3_upper:
        return None, None
    return j3_lower, j3_upper

j2_values = np.linspace(j2_min, j2_max, 500)
j3_lower_values = []
j3_upper_values = []

for j2 in j2_values:
    j3_lower, j3_upper = valid_j3(j2)
    if j3_lower is not None:
        j3_lower_values.append(j3_lower)
        j3_upper_values.append(j3_upper)
    else:
        j3_lower_values.append(np.nan)
        j3_upper_values.append(np.nan)

plt.figure(figsize=(8, 6))
plt.plot(j2_values, j3_lower_values, label="Min valid j3", color="blue")
plt.plot(j2_values, j3_upper_values, label="Max valid j3", color="red")
plt.fill_between(j2_values, j3_lower_values, j3_upper_values, color="gray", alpha=0.3, label="Valid range")

plt.axhline(j3_min, linestyle="--", color="black", alpha=0.5, label="j3 limits")
plt.axhline(j3_max, linestyle="--", color="black", alpha=0.5)
plt.axvline(j2_min, linestyle="--", color="black", alpha=0.5, label="j2 limits")
plt.axvline(j2_max, linestyle="--", color="black", alpha=0.5)

plt.xlabel("j2 (degrees)")
plt.ylabel("j3 (degrees)")
plt.title("Valid range of j3 for different j2 values")
plt.legend()
plt.grid(True)
plt.show()

I thought that I had set the values in the table incorrectly (for this case).
But the behavior of the graph from post 1 still looks strange.

————————————
Quote:1. First, we have a limit of minimum and maximumvalues for j2 and j3.
Quote: Wrote:j2 min = -90 deg.
j2 max = 135 deg.
j 3 min = -160 deg.
j3 max = 280 deg.
And these limits can never be exceeded.
Note: But the limits for j2 and j3 can be changed.
However, the rule
Quote:(-80.5 deg. <= j2+j3 <= 205 deg.)
must always be followed
#3
I think the table should look something like this (It doesn't work) , and the graph should match the graph from the second post.

Code:
-90.0000000    -90.0000000    -75    80    135.0000000    135.0000000
280.0000000    9.5000000    280    -160    -160.0000000    70.0000000
#4
I would like to point out that j2 also depends on the current value of j3.

Because while moving in j2, j3 retains its position relative to the horizon.

For each position j3, the limits of j2 can be calculated based on the same considerations:
j2min (j3) = max (-80.5 - j3, -90)
j2max(j3) = min  (205 - j3, 135)

Quote:For example:
j3 = -160    -----> -79.5 <= j2 <= 135
j3 = 0        ----->  -80.5 <= j2 <= 135
j3 = 10      ----->  -90.0 <= j2 <= 135
j3 = 40      ----->  -90.0 <= j2 <= 135
j3 = 70      ----->  -90.0 <= j2 <= 135
j3 = 71      ----->  -90.0 <= j2 <= 134
j3 = 280    ----->  -90.0 <= j2 <= -75

Also, here is the code for the detailed graph of the dependence of j2 limits on j3
Code:
import numpy as np
import matplotlib.pyplot as plt

j2_min, j2_max = -90, 135
j3_min, j3_max = -160, 280

def valid_j2(j3):
    j2_lower = max(j2_min, -80.5 - j3)
    j2_upper = min(j2_max, 205 - j3)
    if j2_lower > j2_upper:
        return None, None
    return j2_lower, j2_upper

j3_values = np.linspace(j3_min, j3_max, 500)
j2_lower_values = []
j2_upper_values = []

for j3 in j3_values:
    j2_lower, j2_upper = valid_j2(j3)
    if j2_lower is not None:
        j2_lower_values.append(j2_lower)
        j2_upper_values.append(j2_upper)
    else:
        j2_lower_values.append(np.nan)
        j2_upper_values.append(np.nan)

plt.figure(figsize=(8, 6))
plt.plot(j3_values, j2_lower_values, label="Min valid j2", color="blue")
plt.plot(j3_values, j2_upper_values, label="Max valid j2", color="red")
plt.fill_between(j3_values, j2_lower_values, j2_upper_values, color="gray", alpha=0.3, label="Valid range")

plt.axhline(j2_min, linestyle="--", color="black", alpha=0.5, label="j2 limits")
plt.axhline(j2_max, linestyle="--", color="black", alpha=0.5)
plt.axvline(j3_min, linestyle="--", color="black", alpha=0.5, label="j3 limits")
plt.axvline(j3_max, linestyle="--", color="black", alpha=0.5)

plt.xlabel("j3 (degrees)")
plt.ylabel("j2 (degrees)")
plt.title("Valid range of j2 for different j3 values")
plt.legend()
plt.grid(True)
plt.show()
#5
To properly update the interaction map for joints 2 and 3 you should enter the table of joint limits for joints 2 and 3. RoboDK will perform a linear interpolation in the J2-J3 space and uptate the joint limits in the joint sliders.

You can find more information here:
https://robodk.com/blog/robot-axis-coupling/
https://robodk.com/doc/en/General.html#CoupledJoints
#6
Hey, Albert!

Is it possible to fix it in trial version?

Maybe you can help me with update .robot file?
For Fanuc, this is not just a linear interpolation between joint limits.
Please take a look at the graph

It might be useful to have a model close to reality in the robodk library.
I'll test all this on a real robot just in case.
#7
Sure, you can contact us by email so we can help you better:
https://robodk.com/contact


Users browsing this thread:
1 Guest(s)